The dynamics of information-driven coordination phenomena: A transfer entropy analysis
Javier Borge-Holthoefer, Nicola Perra, Bruno Gonçalves, Sandra González-Bailón, Alex Arenas,Yamir Moreno, Alessandro Vespignani. Science Advances, 2016, 2(4): e1501158.
推荐人:郑雅婷
信息驱动的协同动力学:转移熵分析
这篇文章采用了信息理论对当今典型的群体社会事件的结构和特征作出了定义和分析,尤其是当这些事件处在从萌芽到方法传播的时期。文章采用了典型的条件互信息的方法从由时间标度的微博事件中抽取出有向网络,这些网络衡量了由社会系统中不同的地理单元的影响。
该方法可以捕捉到群体社会现象中出现的系统动力学,并对五组推特中来自五个知名社会事件的数据做了分析(好莱坞著名电影的发布、两个大规模的政治抗议、希格斯玻色子的发现、谷歌收购摩托罗拉)。文章中发掘出了两个尺度的相变:一是时间尺度(快或慢),标志着事件的产生;另一个是有向网络中不同的社会单元之间的影响力从无序到有序的相变;该项研究为在开源信息中获取社会事件的分析提供了一个很好的模型和预测算法。但是并不能和潜在的社会事件的预测混为一谈,只是提供了一个很好的技术帮助,比如网络变化节点的检测等。与此同时,这方法对如何在类似的社会事件中分析信息动力学的相变现象提供了有价值的帮助。
Our data sets consist of time-stamped and geolocalized time series of tweets associated to the following events: the Spanish 15M social unrest in 2011, the Outono Brasileiro (“Brazilian Autumn”) in 2013, the discovery of the Higgs boson in 2012, the release of a Hollywood blockbuster in 2012, and the acquisition of Motorola by Google in 2011.
STE quantifies the directional flow of information between two time series, X and Y, by first categorizing the signals in a small set of symbols or alphabet (see section B.3 in the Supplementary Materials), and then computing the joint and conditional probabilities of the sequence indices from the relative frequency of symbols in each sequence, ![]() and Ŷ, as
and Ŷ, as
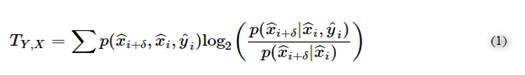
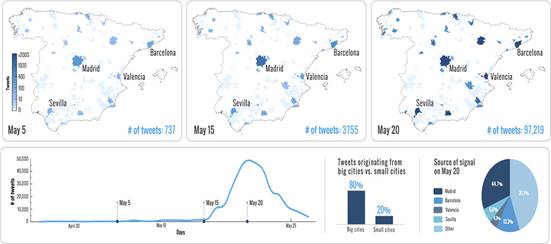
Fig. 1 Spatiotemporal activity as observed from the microblogging platform Twitter.
Spain’s 15M protest growth in time shows that the protest did not transcend the online sphere until May 15 when the political movement emerged on the streets. Broadcasting traditional media started reporting about it soon after; by that time, demonstrations had been held in the most important cities of the country.
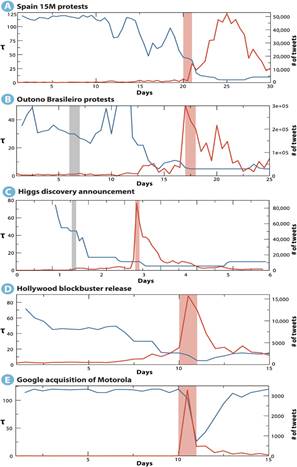
Fig. 2 Characteristic time scale τ.
(A to E) The panels report the variation of the characteristic time scale (blue) that maximizes the STE flow as the social event is approached. Red lines correspond to activity volume (number of tweets). Light red vertical lines correspond to the onset of the main social event. Gray vertical lines (B and C) indicate a smaller precursor event. (A) The 15M event shows a progressive decline of the characteristic time scale well before the actual social event; the same is observed for the Outono Brasileiro in (B) (note a data blackout between days 10 and 11). The patterns for the Higgs boson discovery data set in (C) and the Hollywood blockbuster data (D) also reveal a drop in the characteristic time scale, although this is smoother in the movie case. Overall, in (A) to (D) (endogenous activity), the time scale has already dropped to 50% by the time the absolute volume signals a system-wide event. Finally, the Google-Motorola deal triggers a high volume of microblogging activity without actual change in the time scale of the information flow (E). In this case, the decline is observed in the aftermath of the announcement. As discussed in the main text, this event is the only one that is clearly elicited by an exogenous trigger.
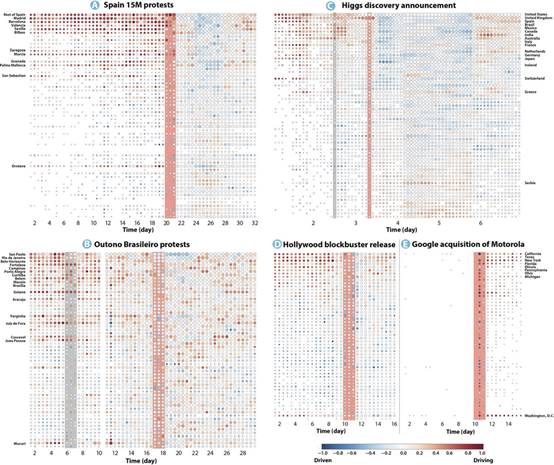
Fig. 3 Evolution of information flow balance between geographical locations for the analyzed events.
(A to E) The color goes from dark blue to dark red (white corresponds to null driving), with the former standing for negative values of ![]() (that is, driven locations) and the latter corresponding to positive information flow balances (that is, drivers). The size of the circles is log-proportional to the number of messages sent from the location at that time, and the vertical bars mark the day of the main event. The geographical locations are ordered according to population size, except for (C), in which countries are ranked with the amount of Higgs-related tweets produced.
(that is, driven locations) and the latter corresponding to positive information flow balances (that is, drivers). The size of the circles is log-proportional to the number of messages sent from the location at that time, and the vertical bars mark the day of the main event. The geographical locations are ordered according to population size, except for (C), in which countries are ranked with the amount of Higgs-related tweets produced.
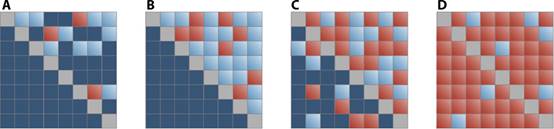
Fig. 4 Schematic representation of a transition from a centralized to a decentralized information flow scenario.
If, for any given pair (x, y), ![]() , all existent dynamical driving is net driving; that is, subsystems present a highly hierarchical structure. In this scenario, if a subsystem dominates another one, the former is not dominated by the latter. This is well illustrated in (A) and (B). Note, however, that only a few subsystems play an active (dynamical) role in (A),whereas the situation has reached a perfectly hierarchical structure in (B). Indeed, in this idealized situation, the net transfer entropy reaches its maximum: any further addition in terms of dynamical driving will decrease the amount of net transfer entropy [as in (C)]. Furthermore, (B) and (C) illustrate that there exists a tipping point beyond which the event has necessarily gone global. The extreme case where every subsystem exerts some amount of dynamical driving results in a “null driving” scenario [as in (D)]. In this schematic representation, the color scales go from dark blue to red, that is, zero to maximum transfer entropy, respectively.
, all existent dynamical driving is net driving; that is, subsystems present a highly hierarchical structure. In this scenario, if a subsystem dominates another one, the former is not dominated by the latter. This is well illustrated in (A) and (B). Note, however, that only a few subsystems play an active (dynamical) role in (A),whereas the situation has reached a perfectly hierarchical structure in (B). Indeed, in this idealized situation, the net transfer entropy reaches its maximum: any further addition in terms of dynamical driving will decrease the amount of net transfer entropy [as in (C)]. Furthermore, (B) and (C) illustrate that there exists a tipping point beyond which the event has necessarily gone global. The extreme case where every subsystem exerts some amount of dynamical driving results in a “null driving” scenario [as in (D)]. In this schematic representation, the color scales go from dark blue to red, that is, zero to maximum transfer entropy, respectively.
原文链接:http://advances.sciencemag.org/content/2/4/e1501158.figures-only

邮箱:sss@bnu.edu.cn 邮编:100875 地址:北京市海淀区新街口外大街19号 学院联系电话:(010)58807880
bat·365(中文)官方网站(官方)EuroCup/下单平台 版权所有

院微信公众号

BNU系统学工